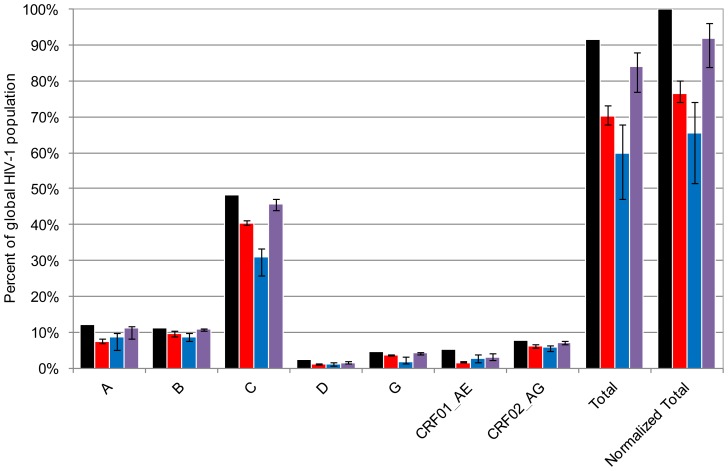
Figure 2. Graphical representation of estimates of epitope conservation of mAbs 2219 and 447-52D.
Black bars represent prevalence of HIV-1 subtypes/CRFs among global HIV-1 population (data from Hemelaar, et al., 2011). For example, the height of the black bar labelled as ‘A’ represents prevalence of subtype A among the global HIV-1 population (12.03%). Other bars represent proportions of HIV-1 population of each clade that exhibit neutralization epitopes of the mAb 2219 (red), 447-52D (blue), or at least one of these mAbs (violet). These data are also summarized in Table 2.

