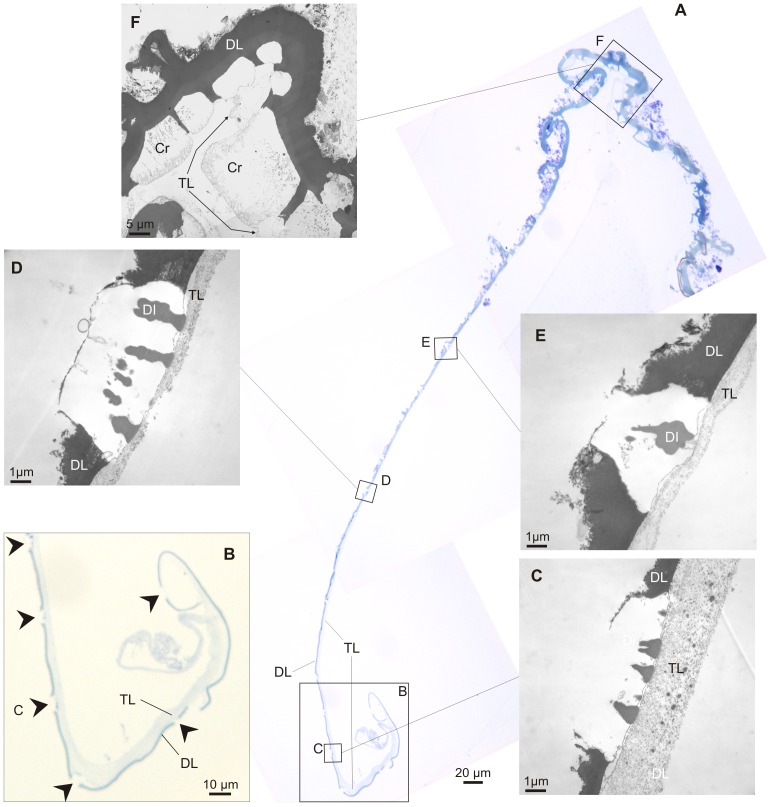
Figure 10. Crystal evolution along the periostracum and shell margin of Neotrigonia gemma.
A. Semi-thin section of the decalcified periostracum and shell margin. B. Enlarged view of the initial part, to show the relative thicknesses of the dark and translucent layers. The translucent layer has detached from the dark layer at the initialmost portion. Arrows point to positions where crystals have been dissolved. C–F. TEM views of forming crystals at progressively older positions. Along the age series the crystals increase in height. The growth surface stays always at the boundary between the dark and translucent layers. Note relative thickness of the translucent layer in C and remains of translucent layer between crystals in F. Cr, decalcified crystals; DI, dark inclusions; DL, dark layer; TL, translucent layer.

