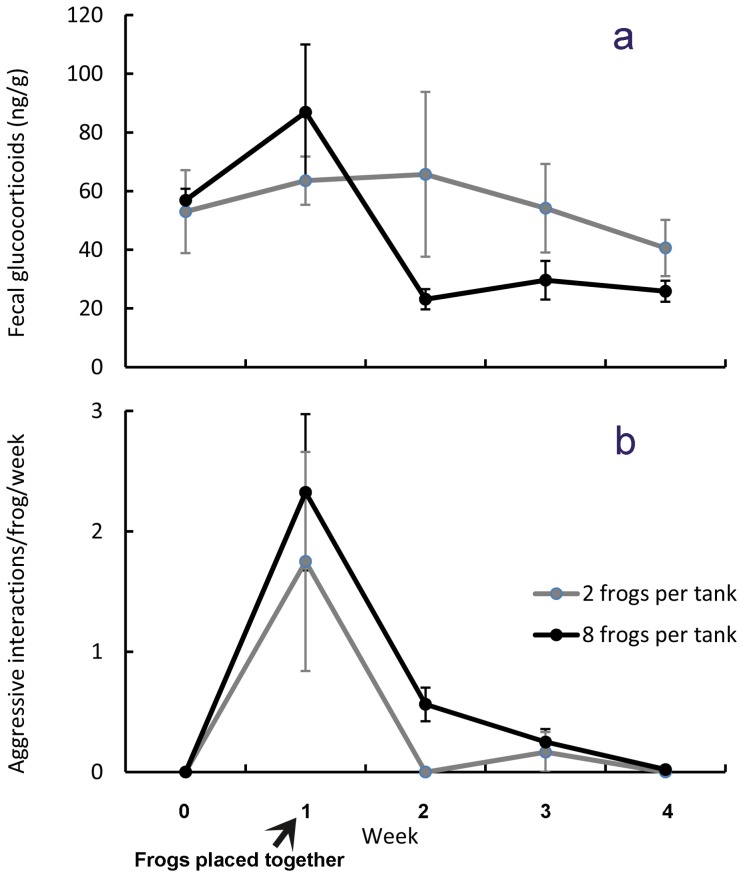
Figure 3. Fecal glucocorticoid concentrations immediately before and after male Atelopus were grouped together at week 1 (ng cortisol/g ± SEM) changed significantly over time (p = 0.04*), but there were no significant differences between groups sizes (A).
Frogs housed singly (mean = 44.2 ng cortisol/g±7.4 SEM) could not be included in this analysis because of too many missing values. Aggressive interactions changed significantly over time (p<0.001***), but there were no significant differences between group sizes.

