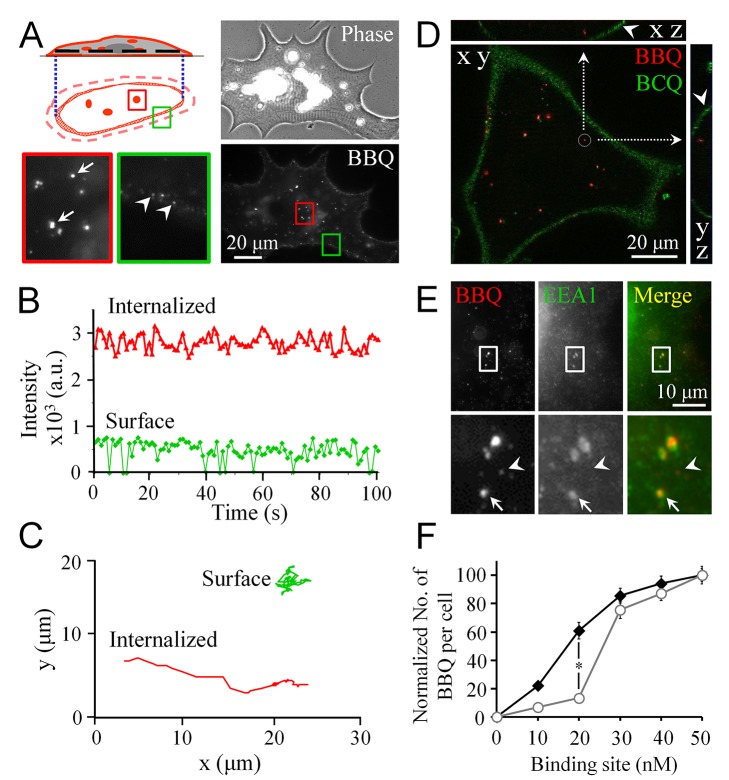
Figure 1. Induction of AChR endocytosis by crosslinking with biotin-BTX and QD-streptavidin (BBQ).
A, A schematic diagram and representative images showing 2 pools of AChRs revealed by BBQ labeling. The fluorescence images were captured at the focal plane in the middle of a muscle cell (depicted as a black dotted line in the schematic diagram). Arrows indicate internalized AChRs (in the red box); arrowheads indicate surface AChRs (in the green boxes). The colored, boxed regions were magnified by 5 times for clarity. B, Two representative fluorescence intensity profiles of BBQ signals of distinguishing internalized and surface AChRs. Internalized AChRs (red curve) showed higher fluorescence intensity compared with surface AChRs (green curve). Moreover, because single QDs blink, the fluorescence intensity (background-subtracted) of the surface AChRs occasionally dropped to zero. C, Two representative trajectories showing distinct movement behaviors of internalized and surface AChRs. Linear movement represents internalized AChRs, whereas Brownian motion represents surface AChRs. D, A representative image reconstructed from a z-stack maximal projection showing the subcellular localization of BBQ-labeled internalized AChRs. To outline the cell membrane (arrowheads), the ganglioside GM1 was labeled with biotin-CTX and then with streptavidin-QD (labeled as BCQ). E, Colocalization of BBQ-labeled internalized AChRs with the early endosomal marker EEA1 (arrow). Arrowheads indicate newly internalized AChRs prior to endosomal fusion. F, Correlation between AChR binding sites and internalized AChRs. The concentration of AChR binding sites was manipulated by either reducing the QD-streptavidin concentration (filled circles) or by masking the biotin-binding sites of QD-streptavidin with free biotin (open circles). Data are mean ± SEM; *p<0.01 (Student’s t test).

