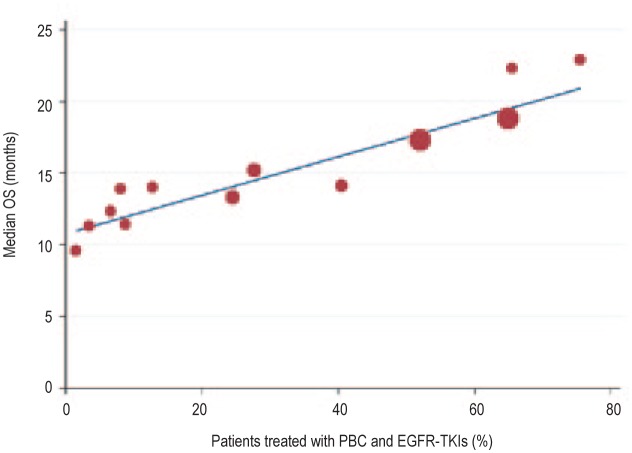
Figure 3. Linear regression curve showing positive correlation between the percentage of patients treated with both PBC and EGFR-TKIs during the course of treatment and the OS (r = 0.936, R2 = 0.876, P < 0.001) in Asian trials.
Mathematic equation of regression (based on a weighted model): OS (months) =10.82 + 13.42 × (percentage of patients treated with both PBC and EGFR-TKIs).

