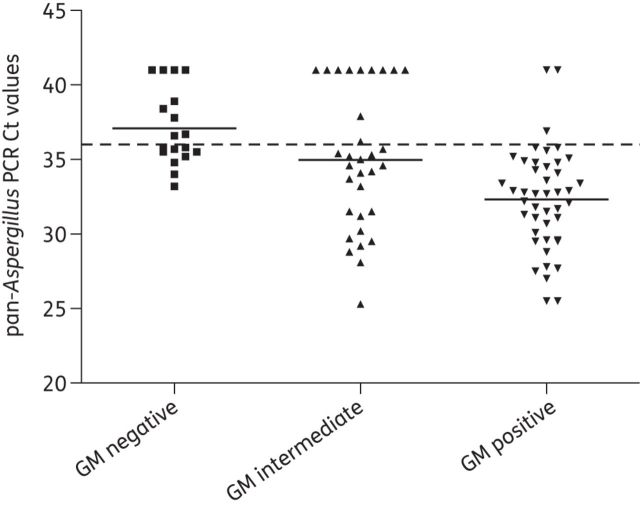
Figure 1.
Distribution of pan-Aspergillus PCR Ct values by categories of GM index. The broken line represents a Ct cut-off of 36 and horizontal bars represent mean Ct values. The mean Ct value of GM-positive samples was significantly lower than that of GM-negative (P < 0.05) and GM-intermediate samples (P < 0.05).

