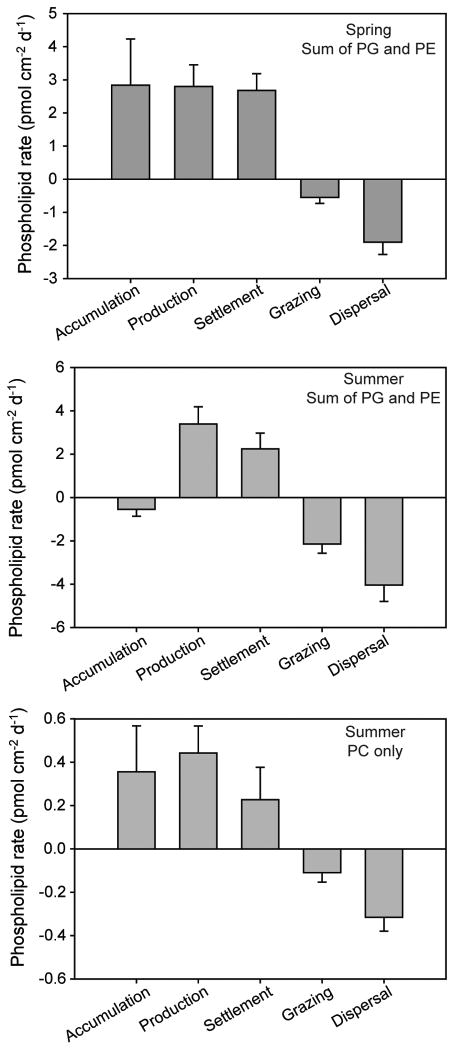
Figure 7.
Rates of key bacterial processes (based on PG and PE) and eukaryotic processes (based on PC) in the process-exclusion experiments. Top: Results showing bacterial processes in the spring experiment. Middle: Results showing bacterial processes in the summer experiment. Bottom: Results showing eukaryotic processes in the summer experiment. Experimental conditions summarized in Table 1.

