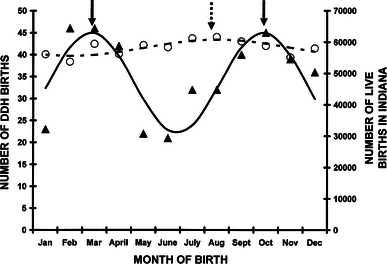
Fig. 1.

Month of birth for 424 children with developmental dysplasia of the hip. Cosinor analysis demonstrated an excellent fit using a 7-month periodicity with the equation: number of DDH births = 33.61 + 11.45(cos(51.4t − 25.7) − 122), where t = 1 is January, 2 is February, 3 is March, etc. This was statistically significant (r2 = 0.70, p = 0.005). The peaks are March 13 and October 12 (solid arrows). The data points are the black triangles and the best fit represented by the bold black line. The numbers of births in the state of Indiana are represented by the open circles and the 12-month cosinor fit by the hatched line represented by the equation: number of live births = 58,234 + 2,586(cos(30t − 15) − 208), where t = 1 is January, 2 = February, 11 = November, 12 = December. This was statistically significant (r2 = 0.60, p = 0.017). The peak was July 30 (hatched arrow)
