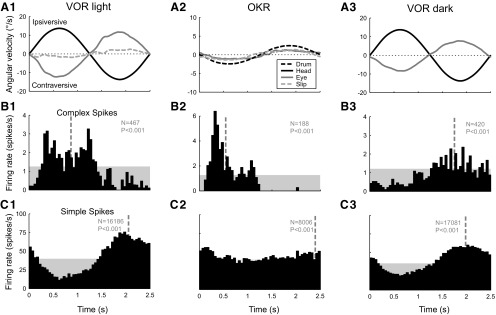
Figure 2.
Histograms of the single-unit activity of an individual floccular VA Purkinje cell recorded during three different stimulus conditions: vestibular stimulation in the light (column 1), optokinetic stimulation (column 2), and vestibular stimulation in the dark (column 3). The stimulus frequency was 0.4 Hz. A, Average angular velocity of the head (black line), the slow-phase eye movement (gray line), and the residual retinal image slip (light-gray dashed line). B, Average CS firing rate. C, Average simple spike firing rate. The amplitude of the optokinetic stimulus (A2, black dashed line) was set to 2.5°/s, so that the magnitude of the retinal image slip (light gray dashed line) approximately matched that of the slip during vestibular stimulation in the light (A1).

