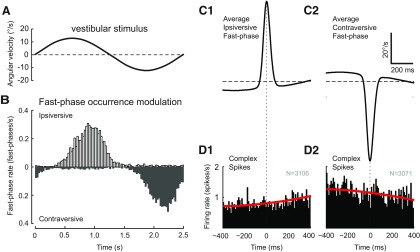
Figure 6.
Absence of a relation between CS activity in the dark and the fast-phases of vestibular nystagmus. A, Head velocity during one full 0.4 Hz stimulus cycle with 12.5°/s table peak velocity. B, Histogram of the frequency distribution of fast-phase occurrences relative to the stimulus cycle (0.4 Hz at 12.5°/s) for the cells illustrated in Figure 5B. Open bins represent ipsiversive fast-phases; gray bins represent contraversive fast-phases. C, Average of all ipsiversive (C1) and contraversive (C2) fast-phases from the VOR dark dataset presented in Figure 5B. Fast-phases were aligned on peak eye velocity. The averages include a portion of the slow-phase eye movement before and after the fast-phase. D, Average CS activity triggered on the peak velocity of either the ipsiversive (D1) or contraversive (D2) fast-phases shown in C1 and C2, respectively. N values indicate the number of fast-phases. Red lines indicate the fast-phase-triggered CS activity computed from the average CS modulation during slow-phase eye movement.

