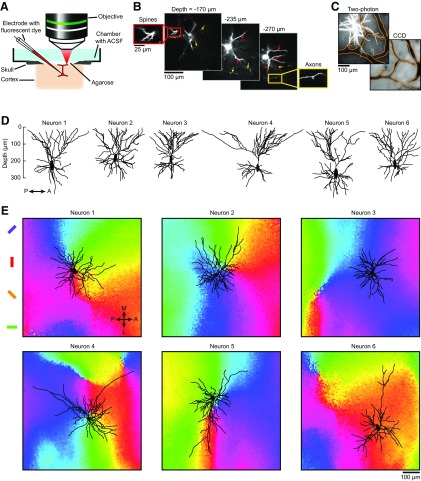
Figure 1.
Experimental setup, reconstructions of dendritic arbors in vivo, and their location in orientation maps. A, Setup used for labeling and imaging dendritic trees in preselected domains of the orientation map. A neuron located in a chosen domain is electroporated with fluorescent dye and its dendritic tree is imaged with a two-photon microscope. B, Imaging planes through a neuron labeled with AlexaFluor 594 at different depths below the pia. Red inset and arrows show dendritic spines; yellow inset and arrows show axons. C, Z-projection (from 0 to 350 μm under the pia) of a neuron labeled with AlexaFluor 594 (top left) and reference image of the surface vasculature captured before intrinsic signal optical imaging (bottom right). To align the two datasets, vessels in the two-photon image were outlined (orange contours) and matched to the vessels in the CCD camera image. D, Sagittal view of six reconstructed somato-dendritic trees. E, The same six neurons were projected along the z-axis orthogonal to the cortical surface and positioned on the local orientation map. The distances between the somas of neurons 1–6 and their closest pinwheel centers are 57, 78, 326, 3, 65, and 459 μm, respectively.

