
Figure 4.
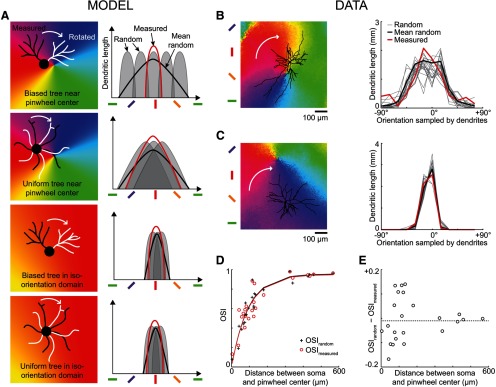
Spread of dendrites in neighboring orientation domains. A, Four possible combinations of symmetric/asymmetric dendritic trees located in pinwheels or iso-orientation domains (left column: black, original dendritic tree; white, rotated tree), and corresponding dendritic orientation distributions (right column: red, distribution before rotation; gray, distribution after random rotation; black, mean distribution after random rotation). The mean distribution after random rotation is broader than the original distribution when the tree is biased toward one of the orientation domains converging at a pinwheel center (row 1), but the two curves are similar in the other scenarios (rows 2–4). B, Z-projection of a dendritic tree located in a pinwheel (left) and the corresponding dendritic orientation distributions (right) before (thick red curve) and after random rotation (thin gray curves; mean, thick black curve). For clarity, only 20 of 10,000 distributions obtained after rotation are represented. C, Z-projected tree and dendritic orientation distributions of a different neuron located in an iso-orientation domain. D, Selectivity (OSI) of each neuron dendritic orientation distribution as a function of the distance between the soma and the closest pinwheel center (red circles, OSImeasured; black crosses, OSIrandom). The red and black curves correspond to the best exponential fits (red, measured: d50 = 64 μm, Amax = 0.95; black, random: d50 = 65 μm, Amax = 0.96). E, Difference between OSImeasured and OSIrandom as a function of the distance between soma and pinwheel center.