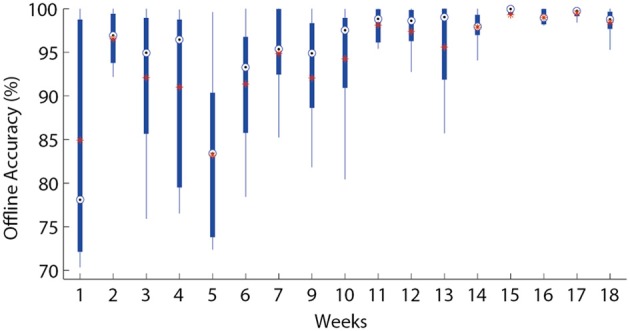
Figure 3.

Offline accuracy. The offline discrimination accuracy over time is presented in box plots where the central mark represents the median value; the edges of the box are the 25th and 75th percentiles; the whiskers give the range of data values; “*” represent average values.
