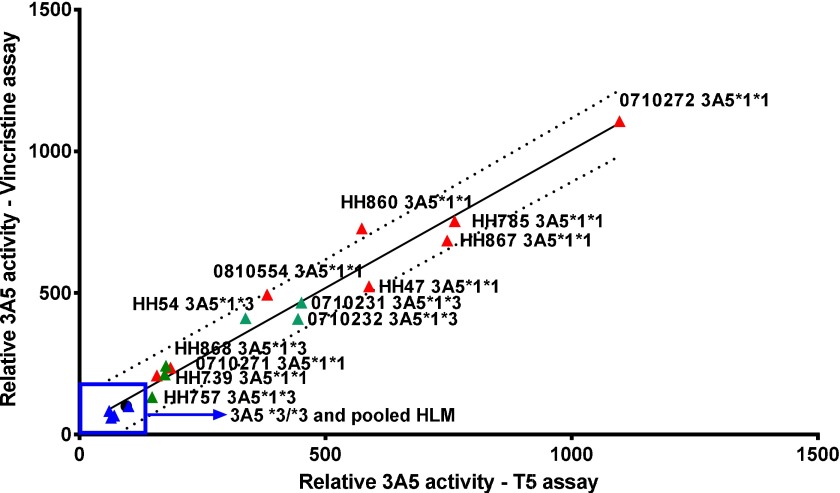
Fig. 5.
Activity correlation. The relative rates of vincristine M1 and T-5 N-oxide formation were compared. Incubations contained 0.1 mg/ml hepatic microsomes and 1 mM NADPH with either 5 µM T-5 or 20 µM vincristine. Activity was normalized against a 150-donor HLM pool, represented by a black circle that is partially obscured by the *3/*3 donor in the upper right-hand side of the boxed-in area. The dashed lines of the regression are the 90% prediction bands. The Pearson r value of the correlation was 0.982, P < 0.0001.

