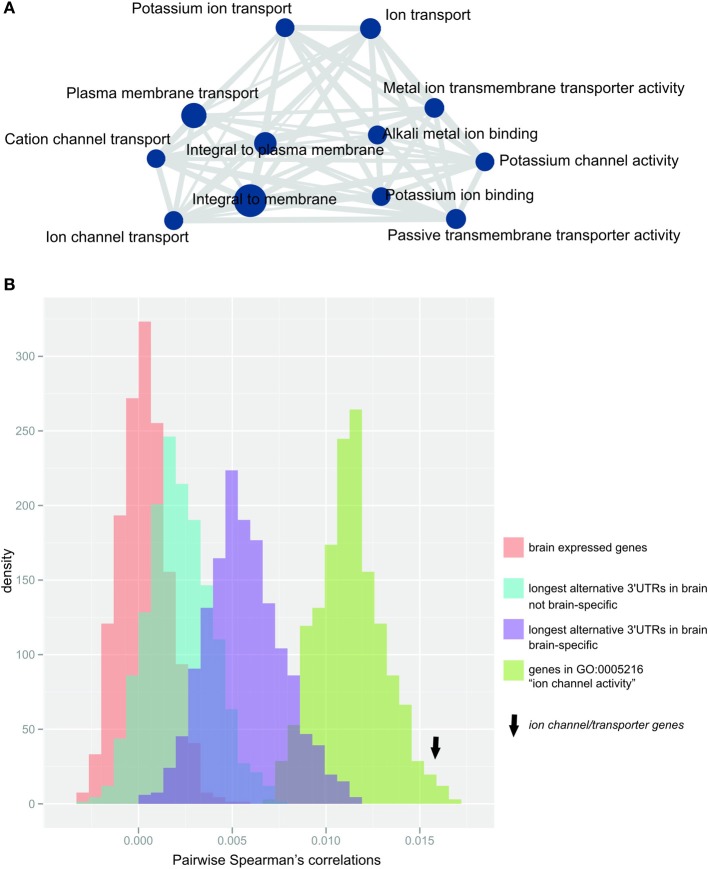
Figure 3.
Ion channel/transporter genes are over-represented within genes expressing their longest 3′UTR in the brain (A) Enrichment map (Merico et al., 2010) of significantly enriched GO-terms after terms were summarized using REVIGO (Supek et al., 2011). Node size (blue circles) reflects the number of contributing genes, and edge size (gray lines) corresponds to the number of genes that are shared between nodes. (B) Distribution of the median pairwise Spearman's correlations for 1000 bootstrap samples of random gene sets (each n = 192, matched to ion channel transporter genes) from the populations: (i) brain-expressed genes (n = 16812 probes; red), (ii) genes with longest alternative 3′UTRs expressed in brain (n = 1261 probes; blue), (iii) genes with longest 3′UTRs expressed only in brain (n = 449 probes; purple) or (iv) genes contributing to GO-term “ion channel activity” (n = 192 probes; green). Arrow indicates the median pairwise Spearman's correlations for ion channel/transporter genes.

