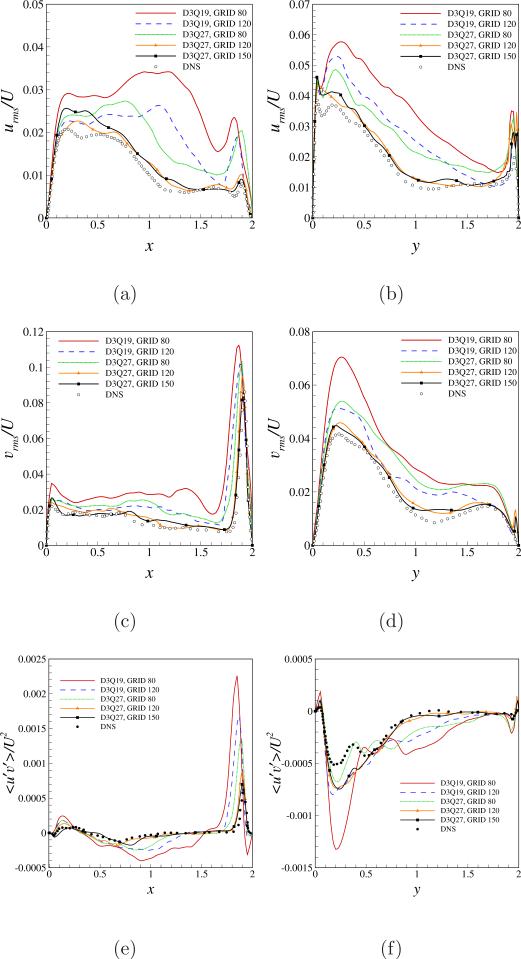
Figure 5.
Profiles of turbulent statistics extracted on the bisecting plane at z = 1 at a Reynolds number of 12000, for indicated lattice type and mesh sizes. (a) Variation of urms/U along x-axis (b) Variation of urms/U along y-axis (c) Variation of vrms/U along x-axis (d) Variation of vrms/U along y-axis (e) Variation of < u′ v′ > /U2 along x-axis (f) Variation of < u′ v′ > /U2 along y-axis.

