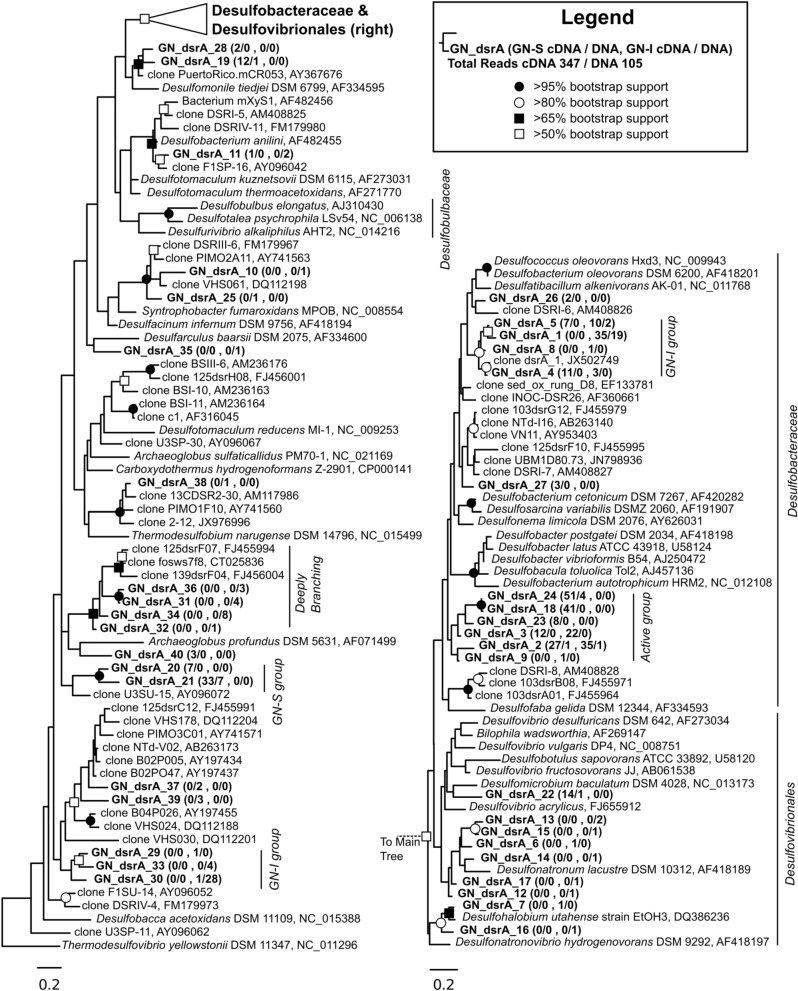
Figure 10.
Phylogenetic relationship of translated dsrA genes and transcripts detected from GN-I and GN-S mats. Maximum likelihood phylogram inferred from partial DsrA sequence data for selected taxa. Symbols denoting bootstrap support values are for both ML and neighbor joining analyses. Representative sequences for OTUs identified from this study are in bold. Numbers in parentheses after study sequences denote number of sequences for each OTU from GN-S mats (first), and GN-I mats (last), with ratios for cDNA/DNA reads shown, respectively.

