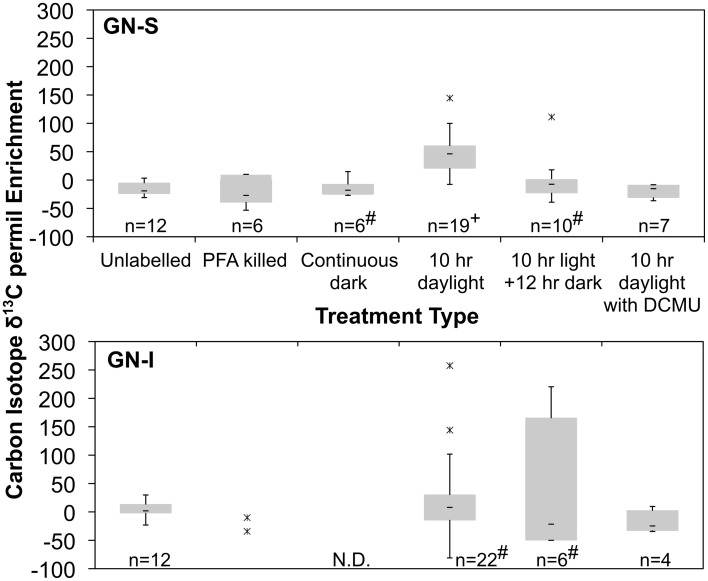
Figure 4.
Quartile box plots of NanoSIMS isotope ratio measurements of Microcoleus morphotype filaments labeled with 13C-bicarbonate for trials of unlabeled, PFA killed, continuous dark, 10 h daylight, 10 h daylight followed by 12 h night, and 10 h daylight with DCMU added. Data was collected via multiple spot measurements of multiple filaments for each mat type (GN-S, at top; GN-I, at bottom). Asterisks are outlier datapoints identified as 1.5*IQR (Inter Quartile Range) outside quartiles. Outliers were retained in analysis. “#” denotes distributions for which the Shapiro–Wilk test p < 0.05. “+” denotes significantly different to all other GN-S trials (Wilcoxon test, p < 0.05). “N.D.” denotes no data taken.

