Figure 9.
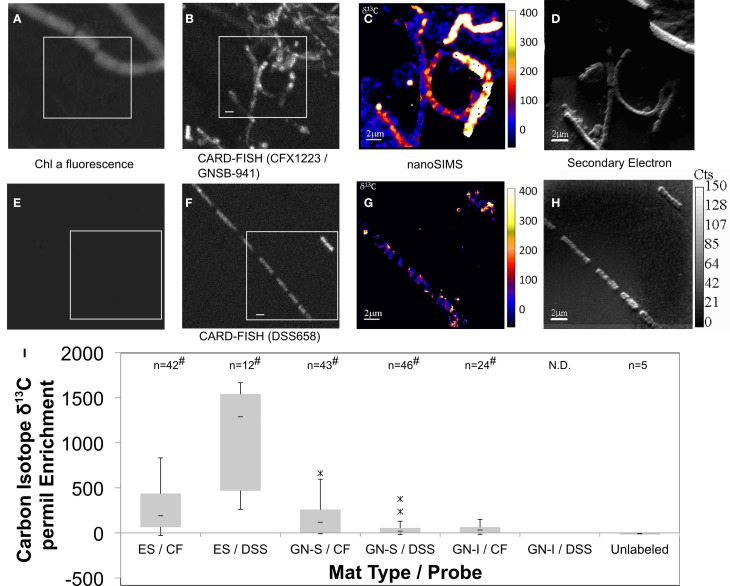
Paired Chlorophyll a natural fluorescence, confocal, CARD-FISH, and 13C-acetate NanoSIMS (permil) micrographs of GN-S mat (A–H). Chloroflexi (CFX1223 and GNSB-941) (A–D) and Desulfosarcina/Desulfobacteraceae (DSS658) hybridized filaments (E–H) shown in conjunction with Chlorophyll a natural fluorescence, CARD-FISH, 13C enrichment, and secondary electron images, respectively. Bar represents 2 μm. Quartile box plots of 13C-acetate NanoSIMS spot measurements from Elkhorn Slough (ES), GN-S, and GN-I mats shown in (I) with significant difference test comparison to isotopic spot measurements on microbial filaments showing no hybridization to either probe. Asterisk denotes outliers 1.5*IQR outside quartiles (though still kept for analysis). “#” denotes both Shapiro–Wilk test p < 0.05 and Wilcoxon difference test p < 0.05 (compared to unhybridized filaments). “N.D.” indicates no hybridized filaments were detected. ES denotes Elkhorn Slough mat samples, CF denotes CFX1223 and GNSB-941 probes, and DSS denotes DSS658 probes.

