
Figure 2. Study Timeline.
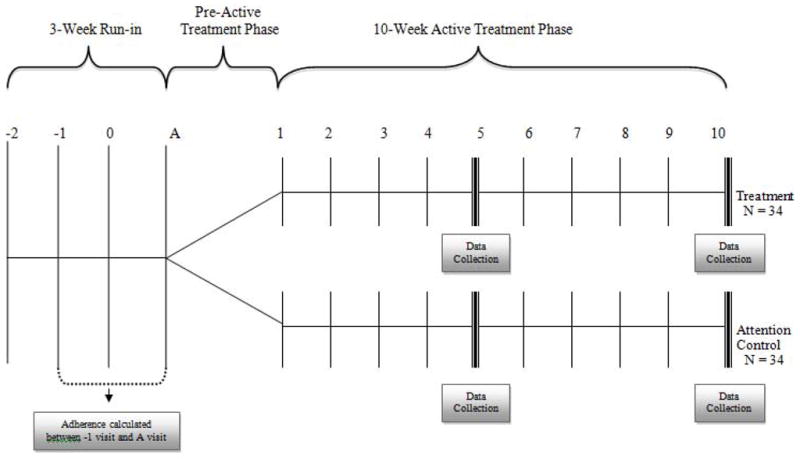
The study timeline illustrates the run-in, pre-active treatment, and active treatment phases. Data collection occurred at weeks 5 and 10 of the active treatment phase.
Official websites use .gov
A
.gov website belongs to an official
government organization in the United States.
Secure .gov websites use HTTPS
A lock (
) or https:// means you've safely
connected to the .gov website. Share sensitive
information only on official, secure websites.
The study timeline illustrates the run-in, pre-active treatment, and active treatment phases. Data collection occurred at weeks 5 and 10 of the active treatment phase.