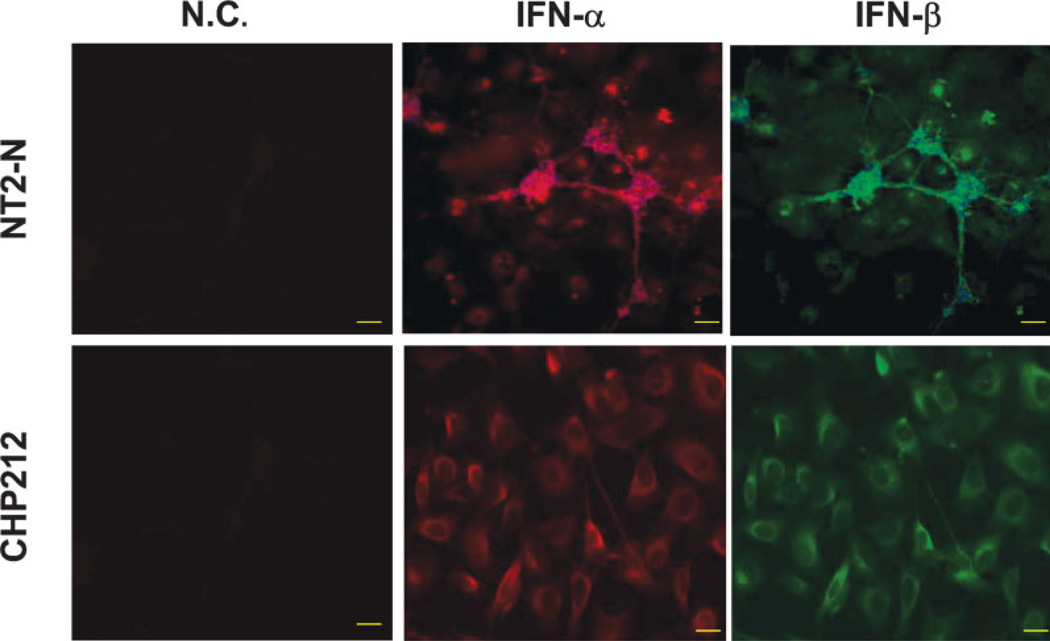
Fig. 2.
Expression of type I IFNs in human neuronal cells. NT2-N cells (upper panel) and CHP-212 cells (bottom panel) were immunostained with antibodies against IFN-α or IFN-β. Mouse/goat IgG1 staining cells were included as negative controls (N.C.). The expression of IFN-α and IFN-β was visualized under microscopy (magnification ×200). Scale bars = 50 µm.

