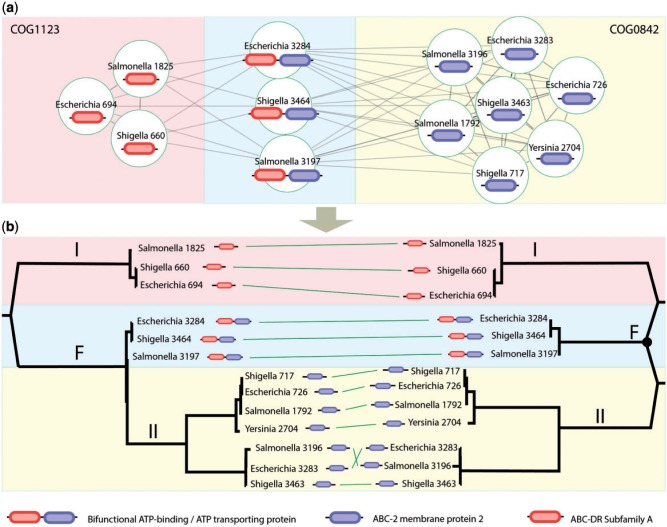
Fig. 4.
An example of a data set that cannot fit onto a conventional phylogenetic tree diagram. The sequence similarity network displays the significant similarity results from a Blast search of the collection of proteins against one another. The tree on the left is the tree recovered from a concatenated data analysis and rooted arbitrarily on the internal branch separating the COG1123 proteins from the rest. The network on the right is what we call an N-rooted network (in this case N = 2, so it is a two-rooted network).

