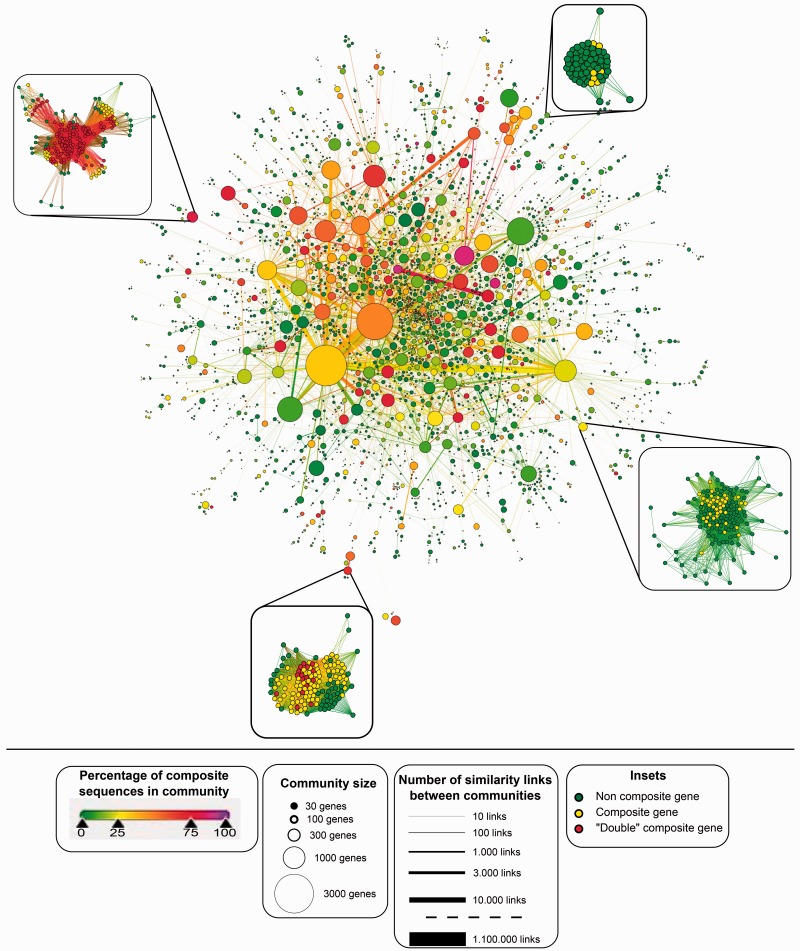
Fig. 5.
GCC from all-against-all BlastP search of 15 eukaryotic genomes. Nodes represent communities as identified using a single pass of the Louvain algorithm. Node area representing size of community and edge thickness is the square root of the number of edges connecting two nodes, with the exception of the largest edge that has its size represented by a thickness five times smaller (corresponding to 220,000 edges instead of the actual 1,100,00). Nodes on the left diagram are colored according to the proportion of composite genes in the community (from green = 0% to purple = 100%). Subnetworks of four communities are displayed around the figure. These communities have been chosen along the range of composite proportion (from light green to light red) to illustrate the variety of community structures. Nodes from these insets are colored in green for noncomposite sequences, yellow for composite sequences, and red for multicomposite sequences, that is, composites sequences whose component genes are themselves composites. See supplementary figure S1 (Supplementary Material online) for a pie chart representation of the proportion of noncomposite, composite, and multicomposite genes in each community.

