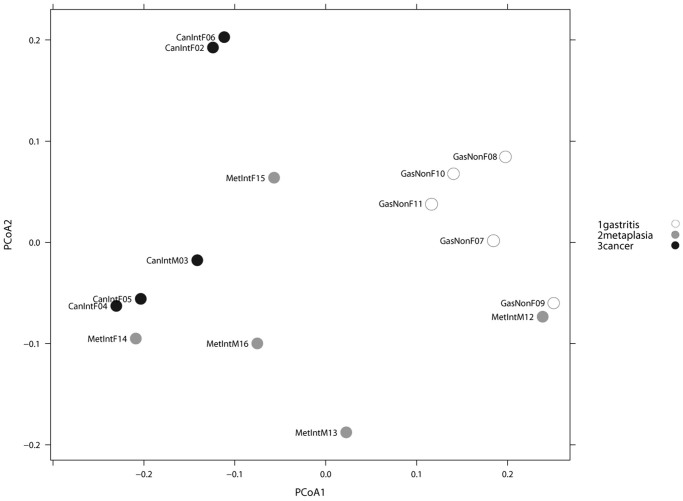
Figure 4. PCoA analyses Weighted Unifrac.
PCoA analyses of the gastric microbiota in non-atrophic gastritis vs intestinal metaplasia vs gastric cancer, based on Weighted Unifrac distance between samples given abundance of 27 taxa with significant abundance difference across at least one of the categories. Axis 1, explained 55% of variation and axis 2, 22%. An entire separation of the microbiota of non-atrophic gastritis and gastric cancer groups along the PCoA1 axis was observed.

