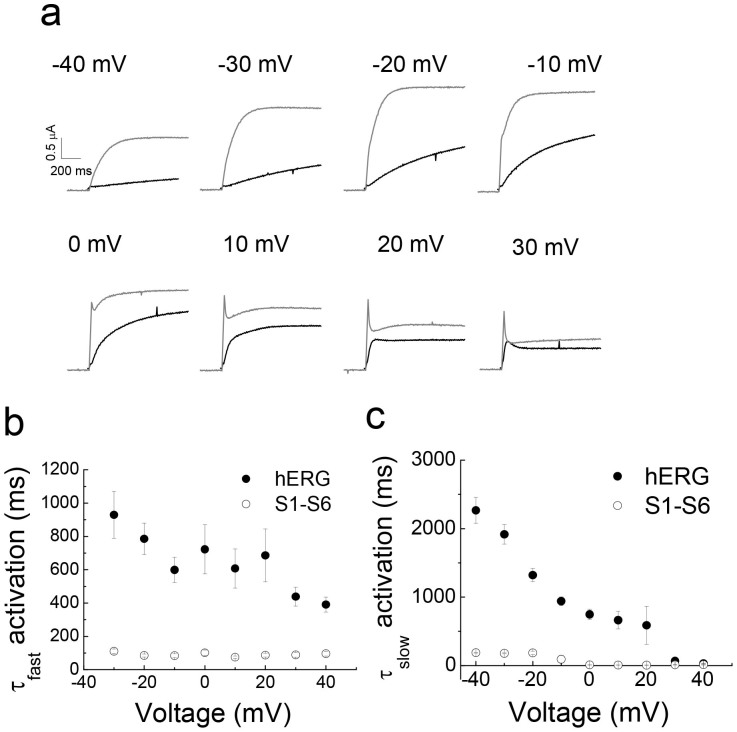
Figure 3. Comparison of the activation kinetics of hERG and the S1–S6 chimaera.
(a) Comparison of representative channel activation current traces between hERG (black traces) and the S1–S6 (grey traces) chimaeras at the indicated voltage steps. (b–c) Comparison of the voltage dependence of fast (b) and slow (c) activation time constants calculated from the activation current traces, as described in methods (chimaera, n = 8; hERG, n = 5). The fast as well as slow activation kinetics of the S1–S6 chimaera are significantly faster than those for hERG (p < 0.05) at all potentials examined.

