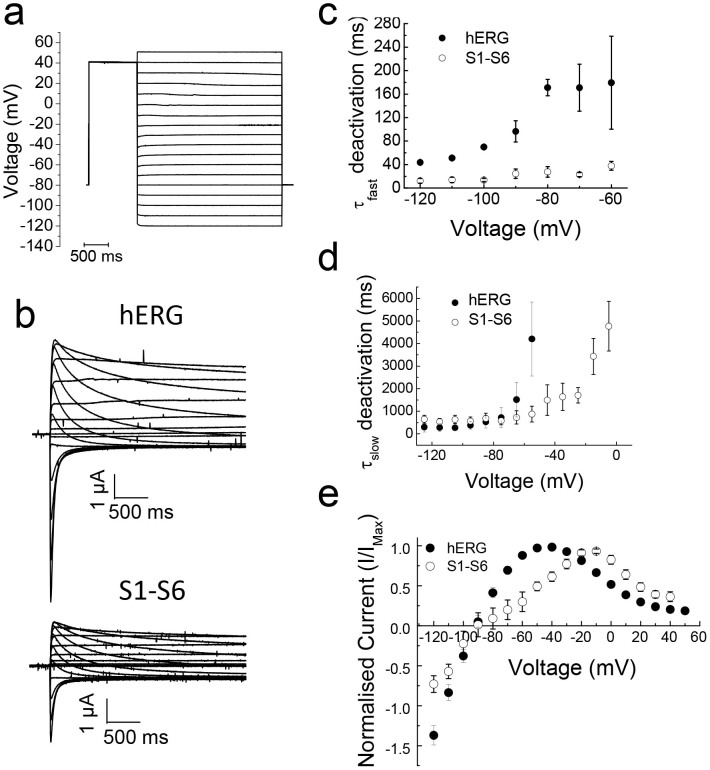
Figure 4. Comparison of the deactivation kinetics of hERG and the S1–S6 chimaera.
(a) Voltage protocol used to measure deactivation kinetics. (b) Representative deactivation current traces of hERG and the S1–S6 chimaera at various voltage potentials following the +40 mV pulse. (c–d) Comparison of the voltage dependence of fast (b) and slow (c) deactivation time constants calculated from deactivation current traces, as described in methods (chimaera, n = 8; hERG, n = 5). The fast deactivation kinetics of the S1–S6 chimaera are significantly faster than those for hERG (p < 0.05). (e) Normalised current-voltage relationships of peak fully activated currents (n = 7). Erev values were calculated by fitting the linear section of the curve and calculating the x-intercept (not shown). Erev values were ≈−90 mV.

