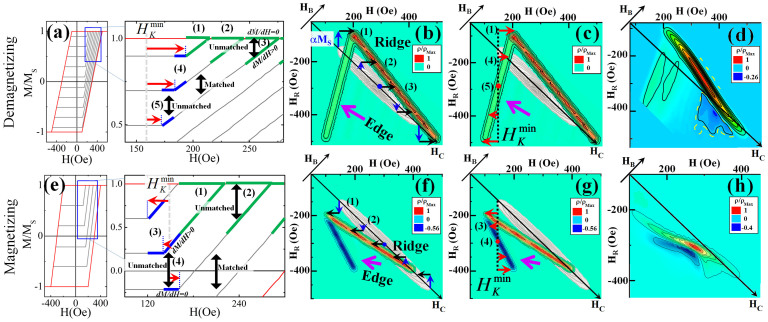
Figure 3.
(a) Schematic illustration of family of FORCs for arrays with a flat coercivity distribution and mean-field demagnetizing interactions, with bold lines and numbers indicating unmatched dM/dH jumps. Calculated FORC distributions are shown in (b) illustrating the construction of the ridge and (c) the edge. (d) FORC distribution with the same interactions, but a Gaussian coercivity distribution; emergent negative feature is indicated by the dashed boundary. Similar panels are shown in (e–h) for the magnetizing case.

