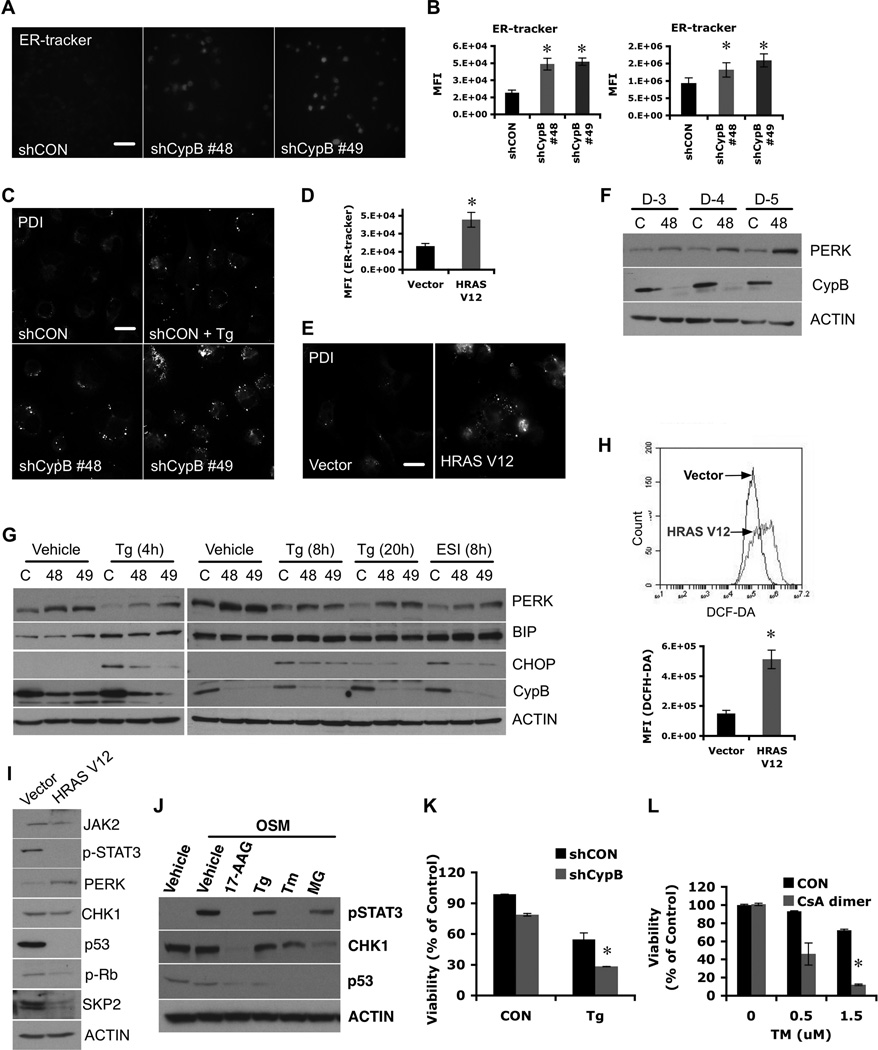
Figure 6. Suppression of Cyclophilin B induces abnormal ER stress.
(A) Increased ER content in CypB-depleted U251 cells. ER content was measured using ER-tracker staining. Bar=40µM. (B) Quantification of ER-tracker signal by flow cytometry in U251 (left) or U87 cells (right). (C) Increased PDI staining in ER stress-induced (thapsigarin treated) or CypB-depleted U251 cells. Bar=40µM. (D and E) Increased staining for ER tracker (D) or PDI (E) in HRASV12-transduced U251 cells. Bar=40µM. (F) Increased expression of PERK in CypB-depleted U251 cells. (G) ER stress-mediated CHOP induction was decreased in CypB-depleted GBM cells. Contol or CypB-depleted cells were treated with thapsigargin (Tg; 4, 8 and 20h) or eeyarestatin Ι (ESI; 8h). Induction of ER chaperones, PERK, BiP, or CHOP, was measured by westernblotting. (H) Increased ROS levels in HRASV12-transduced U251 cells (HRASV12). (I) Activation of oncogenic Ras induced molecular changes similar to CypB silencing, including increased PERK expression and reduced levels of mutant p53, Skp2, and phospho-Stat3. (J) ER stress suppressed Chk1 and mutant p53 expression and Stat3 activation. Cells were pretreated with 17AAG, Tg, tunicamycin (Tm) or MG132 (MG) and stimulated with OSM. (K) Reduced cell viability in response to ER stress in CypB-depleted cells. Control or CypB-depleted U251 cells (D-1) were treated with Tg for 48h. Cell viability was measured by AlamarBlue assay. (L) Combined treatments with CsA-dimer and Tm increased tumor cell killing effects in T98G cells, as determined by AlamarBlue assay. Bar=200µm. Errorbars show ±SD. *p<0.05.

