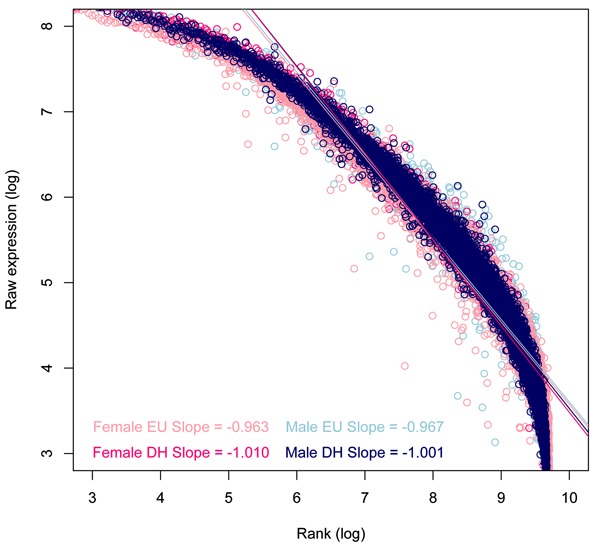
Figure 1. Raw microarray data from the supraoptic nucleus, considered Present in either the euhydrated (EU) or dehydrated (DH) state, were used. Male and female data were handled separately. The median expression value calculated for all samples set the experiment log rank against which the log expression per condition was then plotted. Slope, intercept and linear regression (least squares) were then calculated. The slope is closer to Zipf's exponent of -1 following DH compared to the EU arrays.

