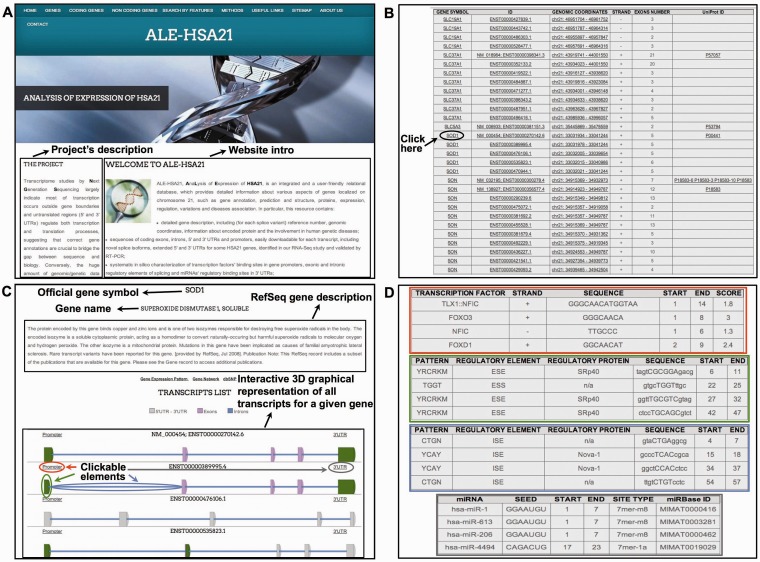
Figure 2.
Screenshots from ALE-HSA21 web resource. Panel (A) shows the Homepage with Navigation Bar; panel (B) shows the list of HSA21 transcripts in the ‘Coding genes’ section in tabular format. Official gene symbol, ID, genomic coordinates, the sense of transcription, the number of exons and UniProt IDs are reported. The Black arrow and circle indicate an example of a clickable item (SOD1 gene in the example). By clicking there, the users access the Gene Description page, depicted in Panel (C). Interactive 3D graphical representation for each transcript is embedded in this web page. Each gene element is linked to results of in silico analysis. Colored circles—red for ‘Promoter’, green for ‘exons’, light blue for ‘introns’ and gray for ‘3′ UTRs’—correspond to the clickable elements of the 3D images. The same color scheme is used in panel (D) to indicate the relative results for the computational analyses of those elements.

