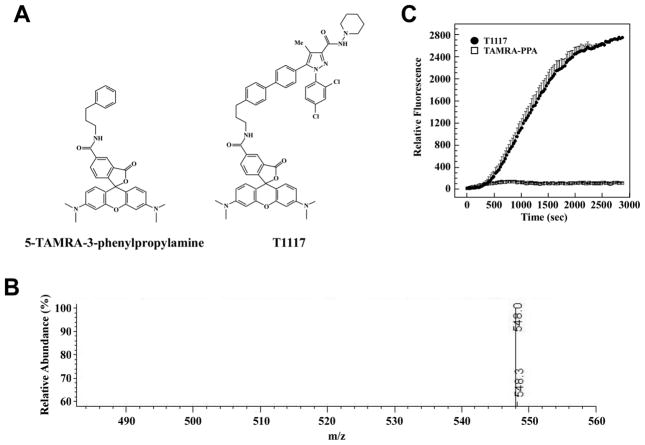
Fig. 1. Characterization of TAMRA-PPA structure and lack of cellular internalization in HepG2 cells.
A, Structure of 5′-TAMRA-3-phenylpropan-1-amine (TAMRA-PPA) and T1117. B, Mass spectrum of TAMPRA-PPA ion, m/z equals 548.0. C, Serum-depleted HepG2 cells were maintained on a confocal microscope stage equipped with a temperature-controlled, humidified CO2 chamber at 37°C, and rates of cellular accumulation of T1117 (10 nM) vs. TAMRA-PPA (20 nM) were determined in ring-shaped regions of interest (ROI) in the cytoplasmic compartments. Plots of signal intensity vs. time were generated from defined ROIs. Note the absence of TAMRA-PPA incorporation in cells.

