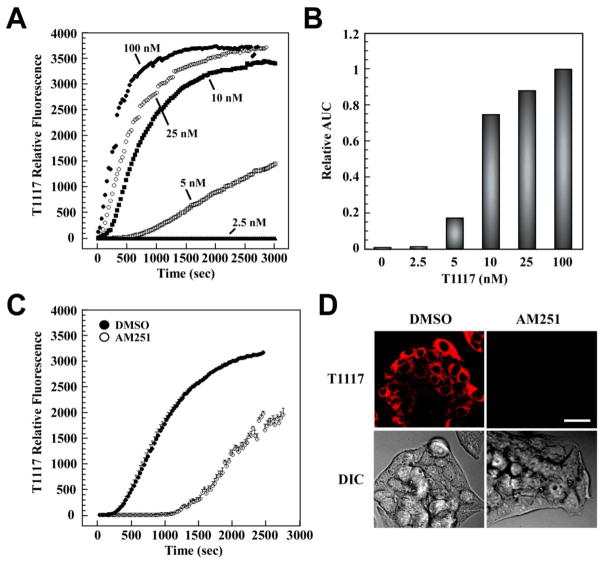
Fig. 2. Rapid and saturable incorporation of T1117 in HepG2 cells.
Cellular entry of T1117 was measured on a Zeiss 710 confocal microscope with thermoregulated chamber system for live cell imaging. A, Serum-depleted HepG2 cells were incubated in the presence of increasing concentrations of T1117 (2.5–100 nM). Plots of signal intensity vs. time were generated from defined ROIs. Results are from 2–3 independent experiments. B, The area under the curve (AUC) in a plot of T1117 internalization against time was obtained and plotted as bar graphs. Relative AUC data vs. T1117 concentrations is shown, with the T1117-AUC value at 100 nM set at 1. C, The cellular incorporation of T1117 (100 nM) was carried out in the presence of a 100× molar excess of unlabeled AM251. Bars indicate mean ± S.D. (n=3 ROIs) from a single experiment, which was repeated twice with comparable results. D, Representative images at t = 15 min are shown. Bar, 30 μm. DIC, Differential Interference Contrast.

