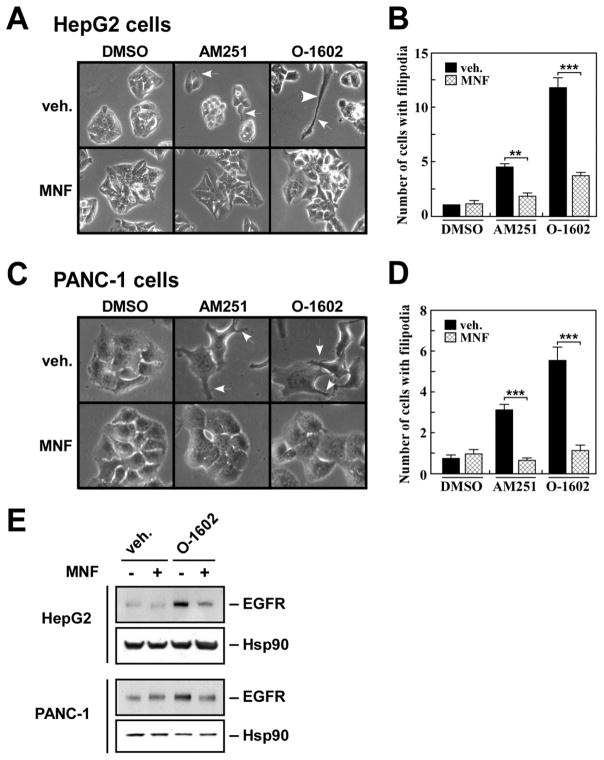
Fig. 8. MNF interferes with inducible changes in cell morphology and expression of EGFR.
Serum-starved HepG2 (A) and PANC-1 (C) cells were pre-incubated in the presence of DMSO (0.1%) or MNF (1 μM) for 30 min followed by the addition of AM251 (5 μM) or O-1602 (5 μM) for 16 h. Unstimulated PANC-1 cells displayed cuboidal morphology with and without MNF. White arrows show individual cells with filopodia. B and D, Bars represent the average number of cells with filipodia per ‘frame’ ± SEM (n=16). Each frame contained an average of 50 and 15 cells for HepG2 and PANC-1 cells, respectively. **, *** P < 0.01 and 0.001. E, Cell lysates were prepared from similar experiments and immunoblotted for EGFR. The membranes were reprobed for Hsp90, which served as a loading control.

