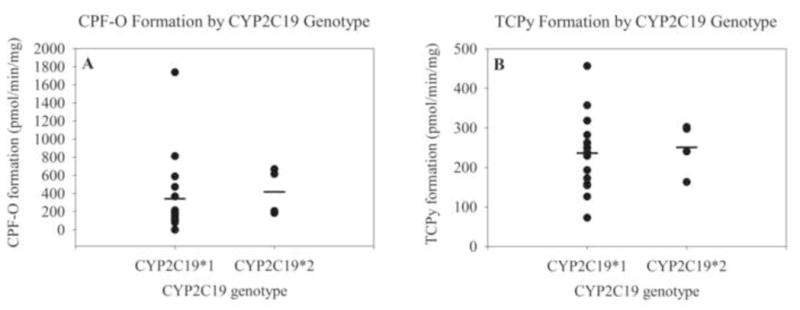
Figure 6.

CPF-O formation (A) or TCPy formation (B) by HLMs according to CYP2C19 genotype expressed as pmol/min/mg. Each dark circle represents an individual HLM and the mean is represented by a black line. The two heterozygous CYP2C19 samples were not included in this analysis.
