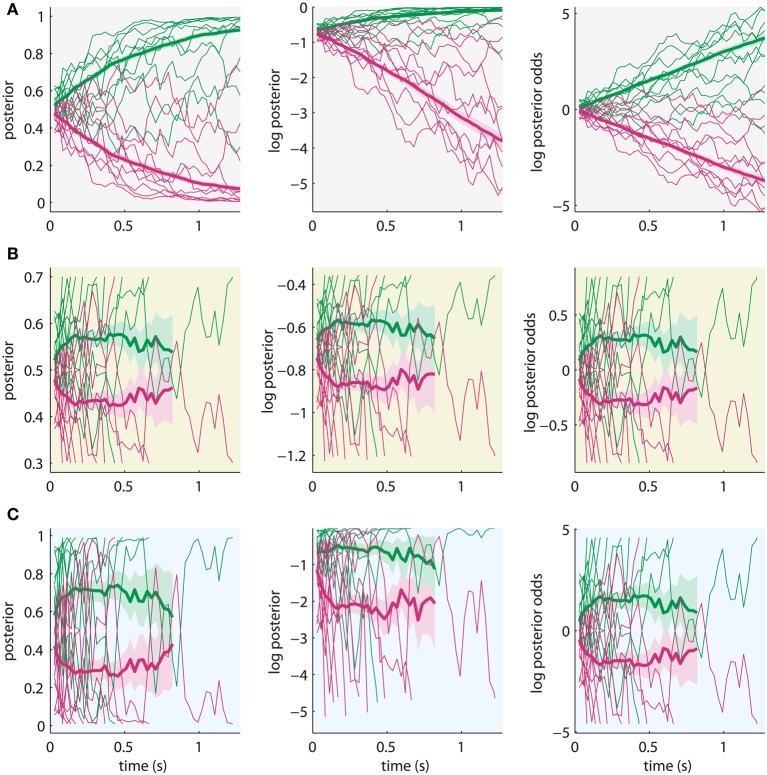
Figure 5.
Sample trajectories from 10 trials (thin lines) and average trajectory over 300 trials (thick lines) of the different decision variables (left: posterior, middle: log posterior, right: log posterior odds) for the same noisy input. Shading around average trajectories indicates their standard error. Green lines: correct alternative, red lines: incorrect alternative. The sample trajectories were simulated using the Bayesian model with parameters which fit behavioral data of the experiment in Philiastides et al. (2011). (A) All trajectories are shown for the maximum length of a trial, ignoring the bounds (λ for posteriors, log λ for log posteriors and λ* for log posterior odds). Decision variables can be differentiated based on asymptotic behavior. (B) Sample trajectories (thin lines) are only plotted until crossing a bound and averages (thick lines) are based only on data points before crossing the bound. Rescaling is applied to account for unknown scaling of neural correlates of the decision variables. Note that standard errors of averages increase with time because fewer trials contribute data at later time points. Average trajectories stop when less than 12 trials contribute data. Decision variables cannot be distinguished. (C) Simulation with parameters which still produce the same decisions, but with very high bound (λ = 0.99). Decision variables may be distinguished, but effects are minor.

