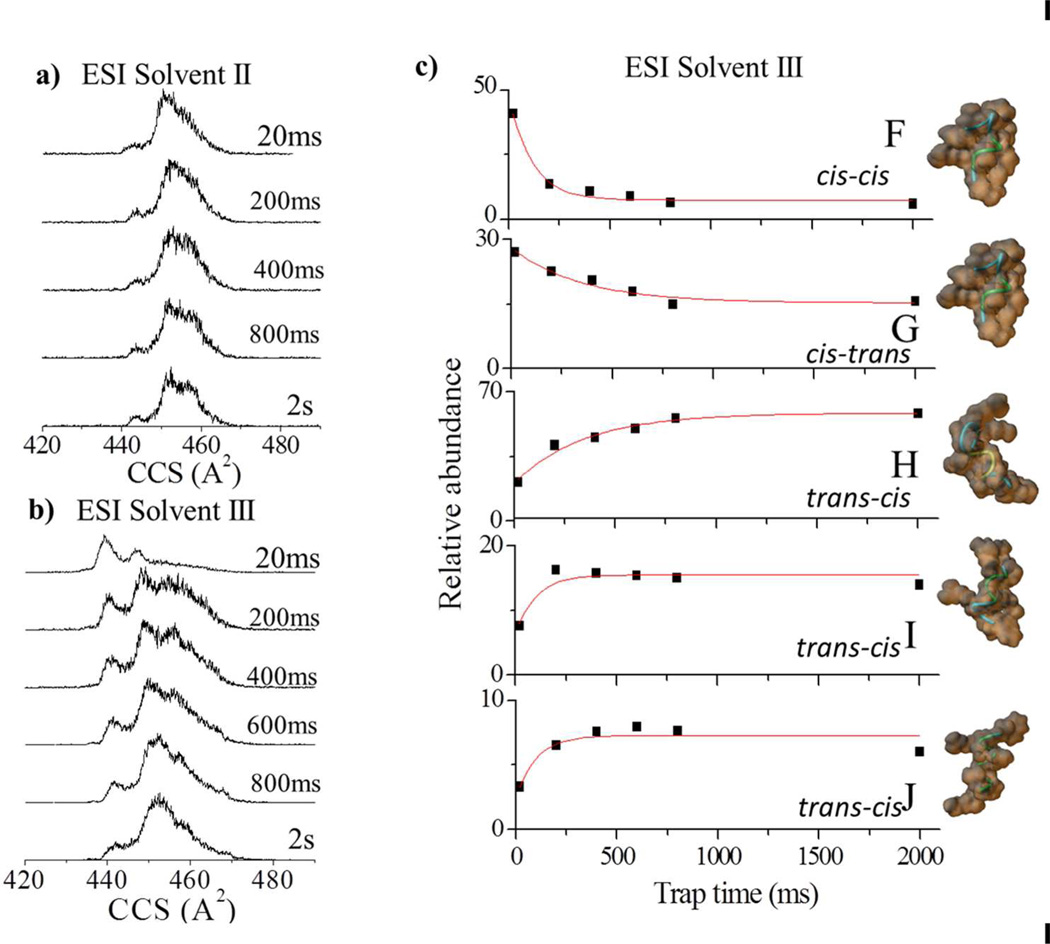
Figure 3.
Typical ATHP [M+3H]+3 CCS profiles for ESI solvent conditions a) II and b) III as a function of the trap time (20 ms to 2 s). The relative abundances and candidate structures for the most abundant bands (F–J) as a function of the trap time is depicted in c) for ESI solvent condition III. Experimental data are fitted with exponential decays. Candidate structures are displayed on the far right with the orientations of the proline residues presented.

