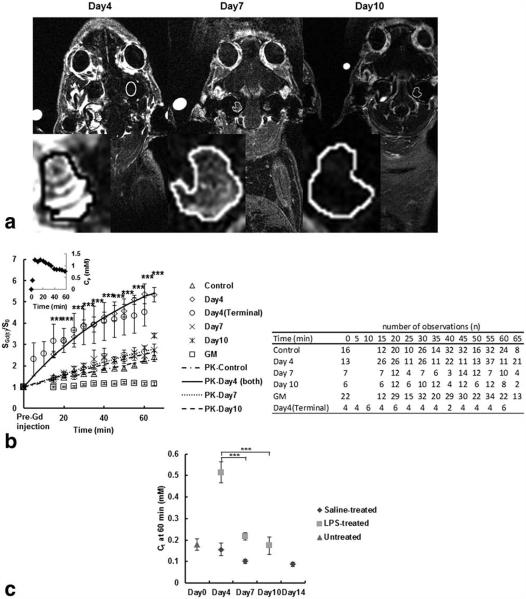
Figure 3.
In vivo DCE-MRI and quantification of signal enhancement at different time points following LPS treatment, the average T1-w signal enhancement at each PK time point at different days after LPS injection and the estimated concentration of contrast agent in the average cochlear tissue. a: DCE-MRI (156 μm × 195 μm × 750 μm) of a guinea-pig cochlea at 55 min following the intravenous administration of 1.5 mmol/kg GBCA and scanned sequentially at 4, 7, and 10 days. The highest signal intensity occurred in the cochlea on day 4, and there was a reduction in signal intensity at day 7 and 10. Insets (magnified cochlear ROI) show the change in signal and distribution of GBCA in the cochlea. b: The change in signal enhancement (SGd/S0 mean±SEM) after GBCA administration in cochlear tissues and grey matter (GM) in control (saline and untreated) and LPS-treated guinea-pigs at days 4, 7, and 10 and, in cochlear tissues in LPS-treated guinea-pigs on day 4 shortly after GBCA injection. Note that the signal enhancement is the greatest in the LPS-treated cochlea on day 4 (***P < 0.0001), but this returns to control levels on days 7 and 10. Signal enhancement is apparent as early as 2 min post-GBCA administration at day 4 (terminal) post-LPS injection. The fittings of each time course curve, except for GM, using the PK model are plotted and the plasma GBCA concentration variation used in the modeling is shown in the inset. The table shows the number of observations at each time point used to run the statistical tests. c: Development of inflammation in the guinea-pig cochleae as the function of GBCA concentration (Ct) in cochlear tissues (mean±SEM) calculated using Eq. (1) 60 min after GBCA injection in control untreated guinea-pigs, saline-treated, and LPS-treated guinea-pigs at days 4, 7, and 10. The (Ct) after GBCA injection increased significantly 4 days after LPS treatment (***P < 0.0001), but dropped to baseline levels on days 7 and 10 (***P < 0.0001).

