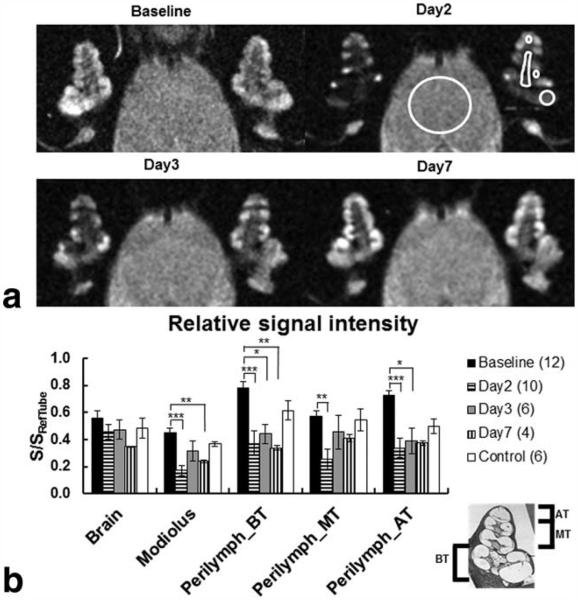
Figure 6.
The spatiotemporal profile of USPIO distribution in the guinea-pig cochlea and brain over 7 days after LPS treatment (117 μm × 117 μm × 700 μm). a: Note the hypointense signals in the perilymphatic spaces of all cochlear turns (ROIs shown in the left cochlea) 48 and 72 h after LPS treatment and the signal intensity recovery to baseline levels on day 7. b: The graph shows the mean±SEM of the relative signal intensities calculated in the brain tissues (ROI large white circle), the modiolus and for both cochleae in the basal turn (BT), middle turn (MT), and apical turn (AT). Cochlear turns and the modiolus (ROIs) are depicted in the left cochlea on day 2. The relative signal intensities calculated at baseline and on day 2 were averaged in the control group. Note that there were significant decreases in relative signal intensity between baseline and day 2 after LPS treatment in all cochlear turns (pBT=0.0005, pMT=0.0344, pAT=0.0017), and modiolus (pMod < 0.0001). In contrast, no changes in relative signal intensity were found in brain tissues within 7 days after LPS treatment (p=0.4775).

