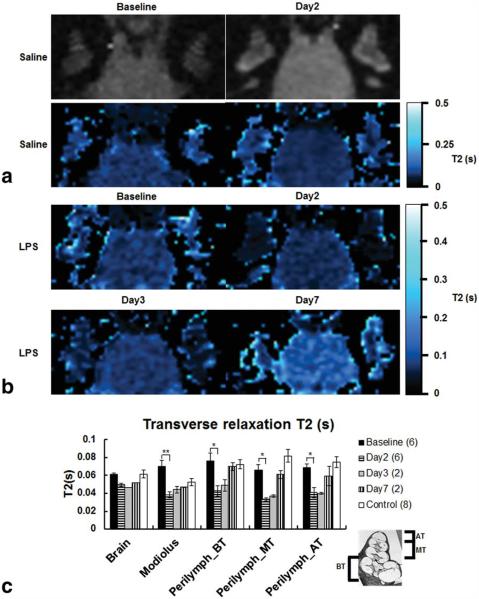
Figure 7.
Low resolution T2-weighted MR images (234 μm × 469 μm × 700 μm, TE=20 ms) and corresponding T2 maps of the saline-treated guinea-pig cochlea, and T2 maps of LPS-treated guinea-pig cochlea and brain tissues over 7 days after LPS treatment and the comparison of T2 values from ROIs covering the areas as shown in Figure 6. a: There are no noticeable differences in T2 mapping of the saline-treated guinea-pig at baseline and on day 2. b: Note that in T2 maps on days 2 and 3 the cochlear tissues were almost invisible except for few pixels located in the endolymphatic fluid space. These maps were generated using the following set of parameters for the MRI plugin: R2 > 0.90, clip value < 1 s, over/under thresholds=0.02 s/0.5 s and bilinear interpolation. c: The graph shows the mean±SEM of the T2 values calculated in the brain tissues, modiolus, and for both cochleae in the basal turn (BT), middle turn (MT), and apical turn (AT). The histological cross-section (inset) shows the location of cochlear turns. The T2 values calculated for control guinea-pigs at baseline and day 2 were averaged. Note that there were significant decreases in T2 for all cochlear turns and the modiolus between baseline and day 2 (pBT=0.0096, pMT=0.0002, pAT=0.0015, pMod=0.0112). In contrast, T2 was not significantly different in brain tissues (p=0.0844).

