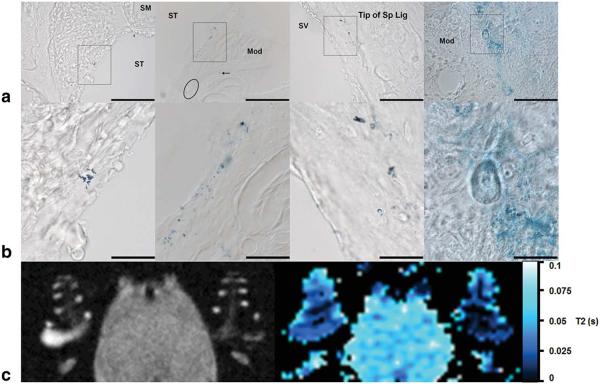
Figure 8.
Iron staining in the cochlea after LPS-induced inflammation and corresponding high resolution T2-w MR image and low resolution T2 map. a: Histological cross sections of the basal and middle turns showed iron staining as clusters of iron particles (rectangles) and few iron particles (arrow) (Magnification: 40 ×). b: Magnified black rectangles showing the clusters of iron particles within identified cochlear tissues. c: Left: Corresponding high resolution T2-w MR image of the guinea-pig cochlea 2 days after LPS injection showing a significant reduction in signal intensity in the perilymphatic spaces. Right: Corresponding low resolution T2 map generated using the following set of parameters for the MRI plug-in: R2 > 0.97, clip value < 1 s, over/under thresholds=0.02/0.1 s. Scale bars=100 μm in a; 25 μm in b.

