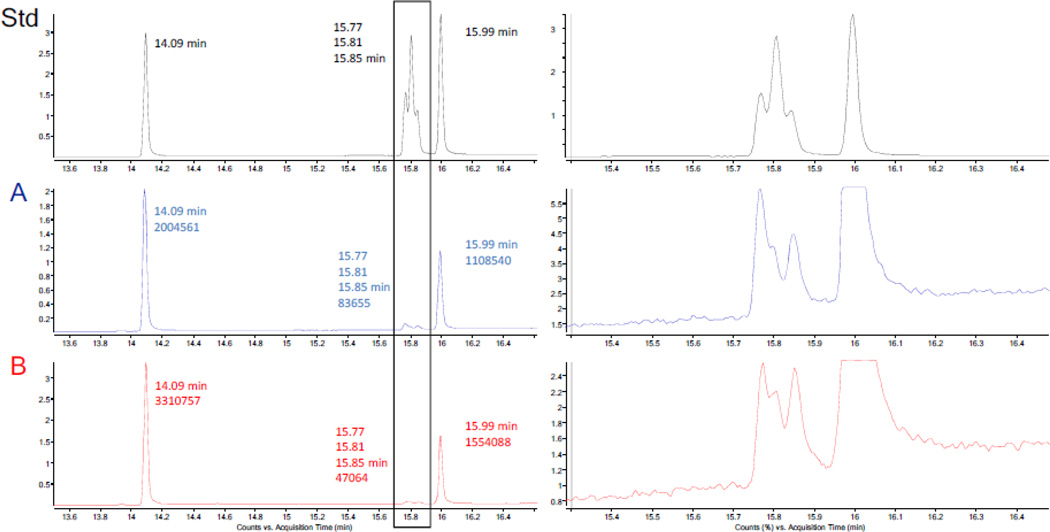
Figure 3.
The GC-MS analysis of the methyl esters of the five standard fatty acids (Std) and the hydrolysates of samples A and B: the left panel represents the full view of the GC-MS TIC chromatogram, the retention times, and the integrals in case of samples A and B; the right panel shows expansion of the GC-MS TIC chromatogram of the three unsaturated fatty acid methyl esters.

