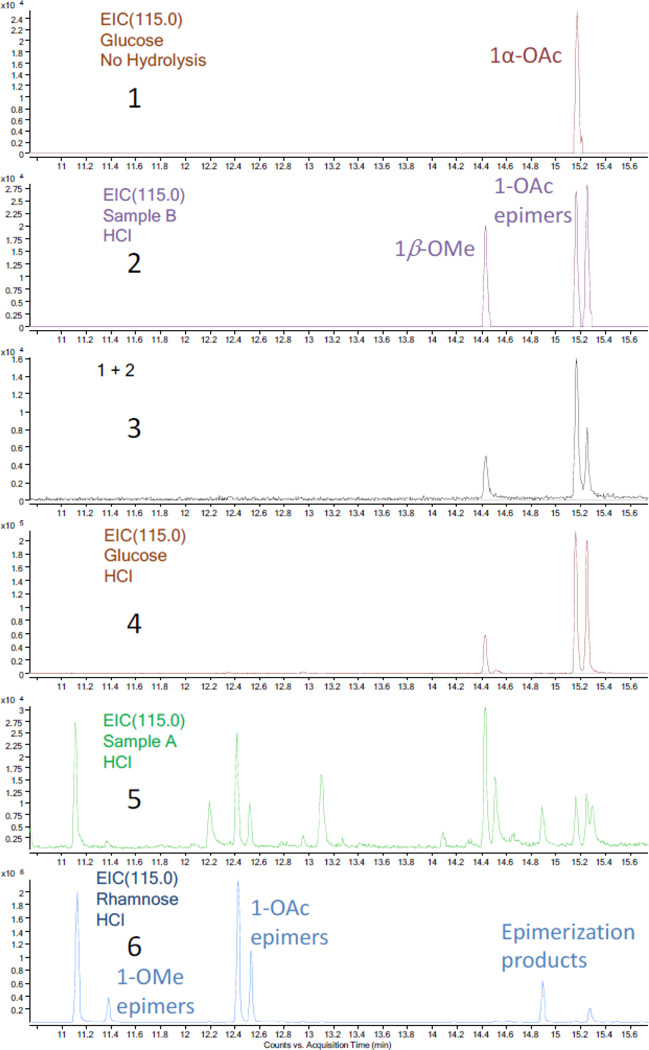
Figure 4.
Comparison of the GC-MS EIC chromatograms (m/z 115.0) of the acetylated products (10.8 to 15.6 min). 1, acetylated glucose standard without the HCl hydrolysis procedure; 2, acetylated product of hydrolysate of sample B; 3, mixture of 1 and 2, giving a higher ratio for second peak; 4, acetylated glucose standard with the HCl hydrolysis procedure; 5, acetylated product of hydrolysate of sample A (low intensity); 6, acetylated rhamnose standard with the HCl hydrolysis procedure.

