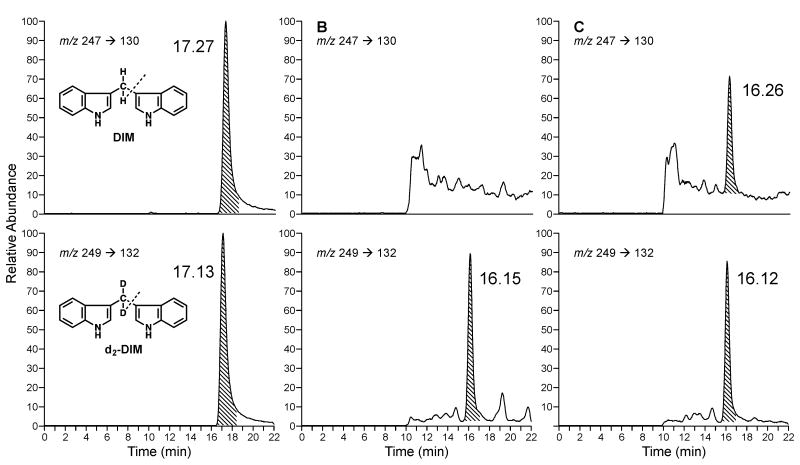
Figure 1.
Representative LC-ESI-MS/MS-SRM chromatograms obtained upon analysis of A, standard DIM (top) and internal standard [2H2]DIM (bottom); B, a urine sample from a subject before eating Brussels sprouts (top) and internal standard [2H2]DIM (bottom), and C, a urine sample from a subject after eating Brussels sprouts (top) and internal standard [2H2]DIM (bottom).

