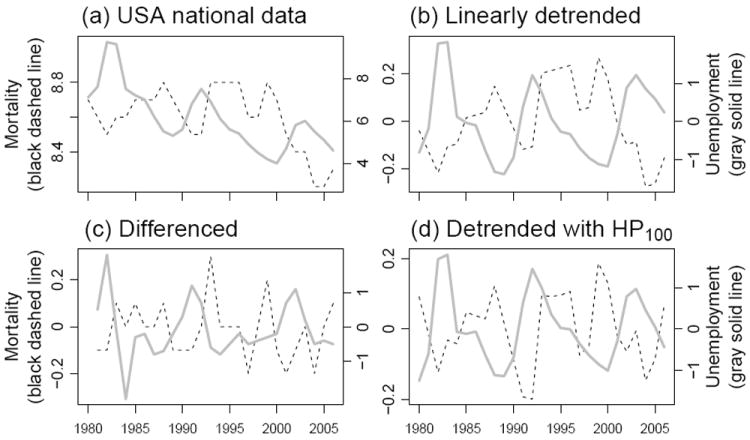
Figure 1.

National mortality and unemployment. (a) Mortality per 1,000 per year, shown as a dashed line corresponding to the left axis scale; unemployment rate, shown as a solid line corresponding to the right axis scale. (b,c,d) The data in (a) detrended using a linear trend, first difference and Hodrick-Prescott filter (λ = 100) respectively.
