
Figure 3.
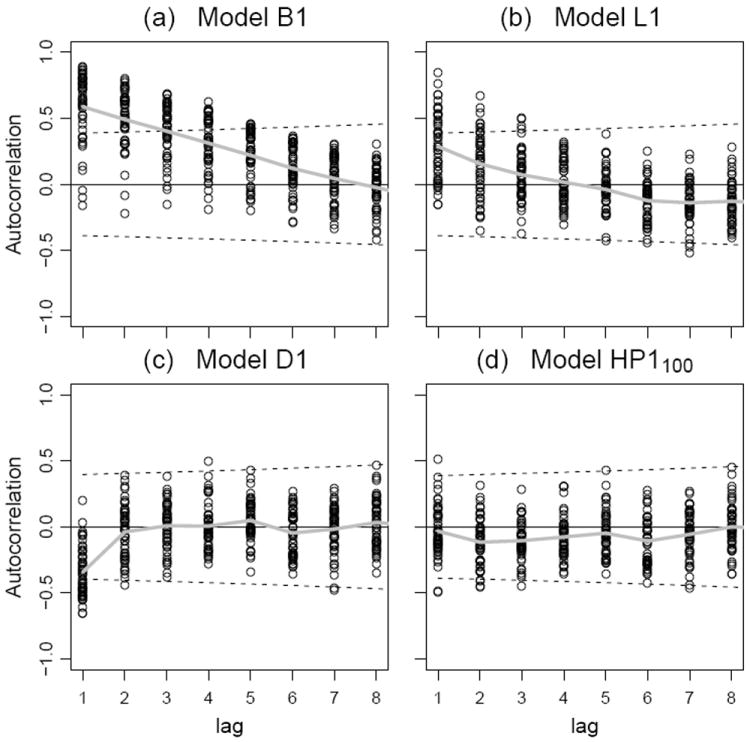
Autocorrelation of the residual in four models for total mortality. Points show the sample autocorrelation for each state at each lag. The dashed lines are at where tn−2 is the 97.5 percentile of the t distribution on n − 2 degrees of freedom, and n is the number of pairs of time points available to compute the sample autocorrelation at each lag. If the residual series were temporally uncorrelated, approximately 95% of the points should lie between the dashed lines (Moore and McCabe, 1999, Section 10.2). The gray solid line graphs the mean sample autocorrelation at each lag.