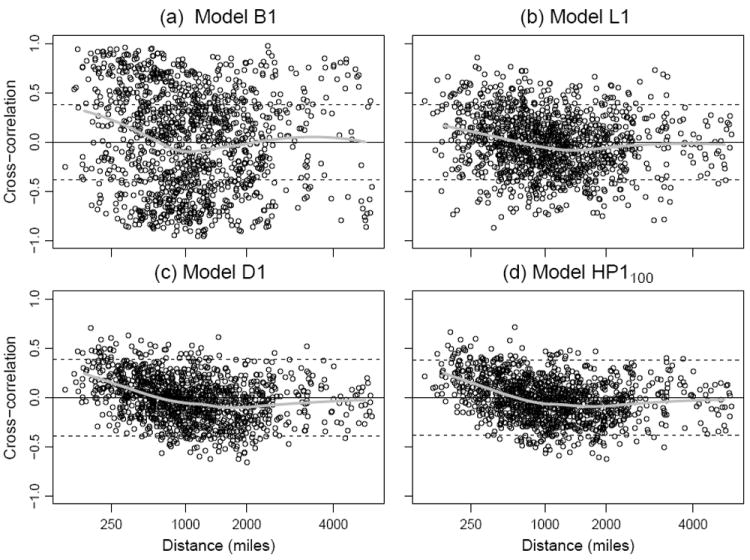
Figure 4.

The crosscorrelation between residuals for each pair of states, plotted against distance between population-weighted state centers (from the 2000 census) in four models for total mortality. The dashed lines are at where tn−2 is the 97.5 percentile of the t distribution on n − 2 degrees of freedom, and n = 27 (for B1, L1, HP1100) or n = 26 (for D1). If the residual series were spatiotemporally uncorrelated, approximately 95% of the points should lie between the dashed lines (Moore and McCabe, 1999, Section 10.2). The actual percentages for models B1, L1, D1 and HP1100 are 46.1%, 79.3%, 90.9% and 91.3% respectively. The gray solid line shows a local linear regression fit to these crosscorrelations, implemented using the loess function in R2.15.0, with the default parameter settings.
