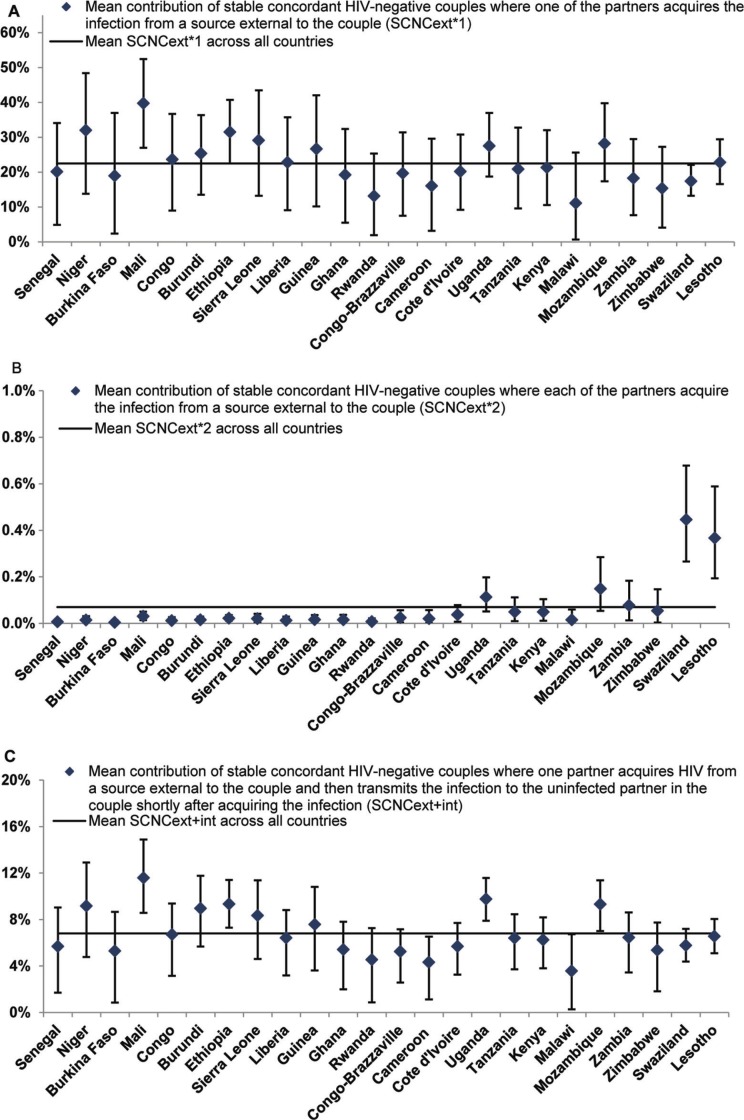
Figure 3.
Mean and 95% confidence interval of the contributions of HIV incidence among stable concordant HIV-negative couples to total HIV incidence in the population in 24 countries in sub-Saharan Africa. The figure shows the contribution of HIV incidence among stable concordant HIV-negative couple where: (A) one partner acquires the infection from a source external to the couple, (B) each of the partners acquire the infection from a source external to the couple and (C) one partner acquires the infection from a source external to the couple and then transmits it to the uninfected partner in the couple. Estimates were calculated based on 10,000 runs of the model for each country using Monte Carlo sampling from triangular probability distributions for the specified ranges of uncertainty of the model parameters. Countries are shown in order of increasing HIV prevalence. The horizontal line in the different panels represents the average for the contribution measure in question across all countries.

