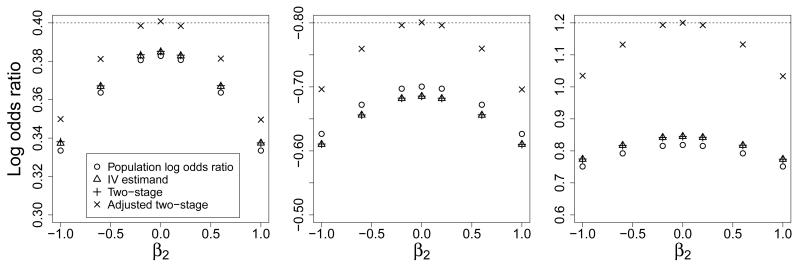
Figure 5.
Population log odds ratio and IV estimand compared to median two-stage and adjusted two-stage estimates of log odds ratio for unit increase in risk factor from model of unconfounded association (Scenario 2) for varying for the covariate effect (β2) with conditional log odds ratio (β1) of 0.4 (left panel), −0.8 (middle panel, y-axis is inverted), and 1.2 (right panel)

