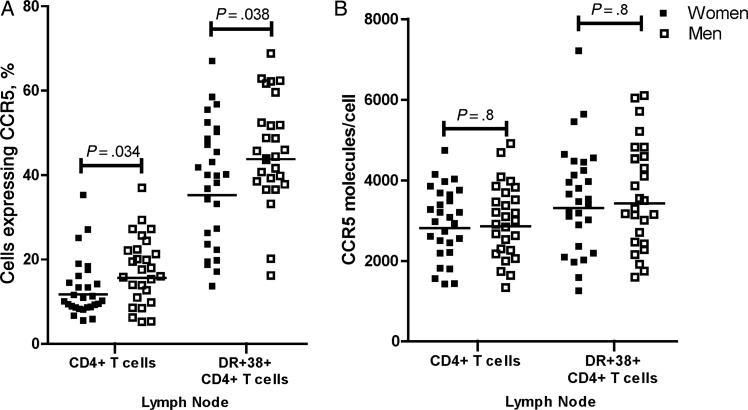
Figure 1.
Percentages (A) and concentrations (B) of CCR5 on CD4+ T cells and HLA-DR+CD38+CD4+ T cells in lymph nodes from human immunodeficiency virus type 1–seropositive women (n = 28) and men (n = 27). Each symbol represents the value for an individual subject. Horizontal lines indicate geometric means.

