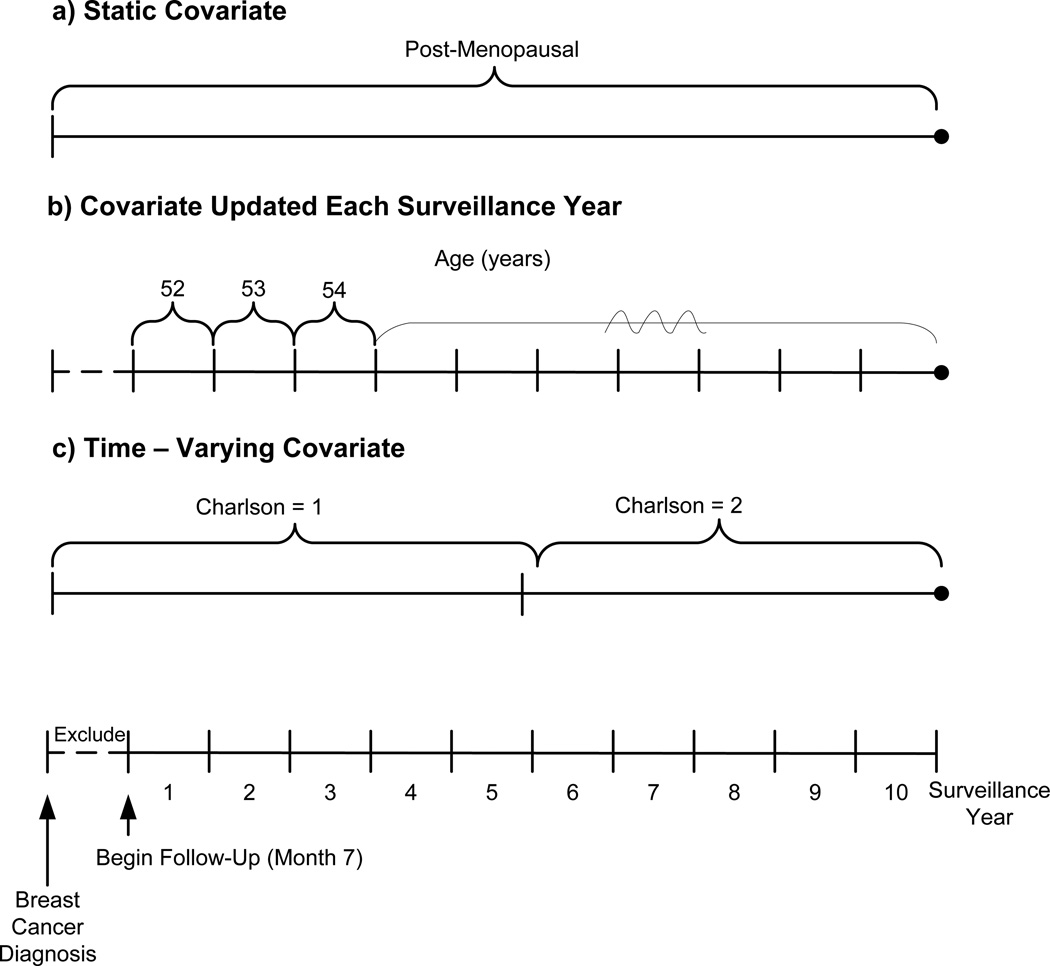
Figure 1. Schematic of covariate types over the entire study period.
- Static covariate: Patient is post-menopausal at diagnosis. She remains categorized as post-menopausal in all surveillance years
- Per surveillance year covariate: Patient’s age = 52 years in year 1. Her age is updated in each subsequent surveillance year
- Time-varying covariate: Patient has Charlson score = 1 at diagnosis; Charlson score = 2 beginning in month 7 of year 5, and no further changes to her Charlson score through year 10. Since she has a new Charlson score for only 5 months of year 5, her Charlson score remains 1 in year 5 and increases to 2 in year 6. She remains Charlson score = 2 for all subsequent surveillance years

